Written by Fernando Maciá
Índice
Gemma Muñoz, Cofounder & CEO of El Arte de Medir, talks about how to use data to transform it into a business asset.
Giving data for decision making does work, but why don’t we get it right?
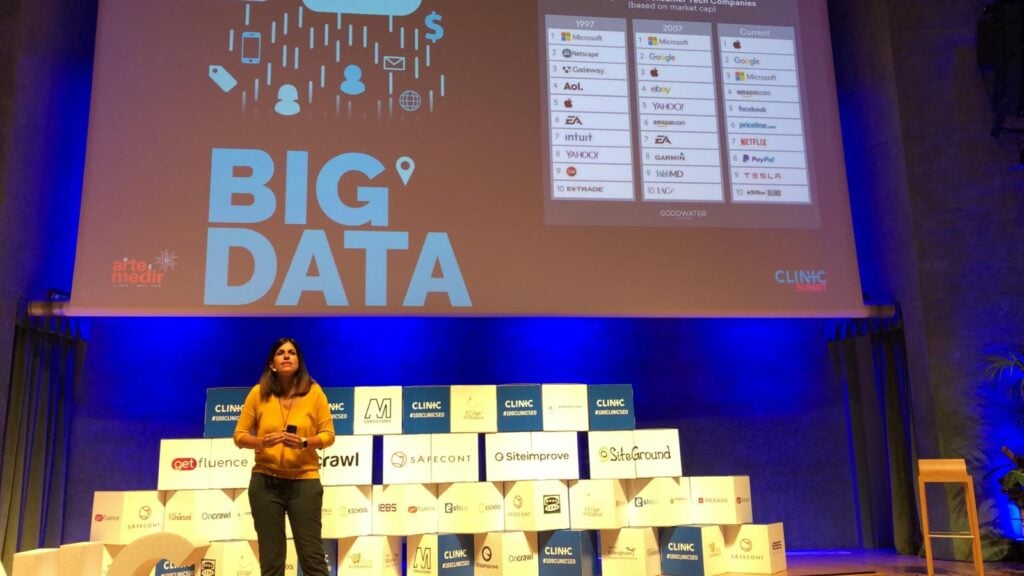
We are immersed in big data, very excited.
Big data is data warehousing. The problem is that they are not used to impact the business. Companies, even small ones, have spent a lot on storing data, technology and people, yet they are not being used for what they should be.
Beyond big data, we are talking about artificial intelligence. In the enterprise, much remains to be done.
If we are spending money on storage and people, why not do better? Because we think of big data as a unicorn: only as technological processes, leaving aside the business side and the transfer of this knowledge within companies.
We have enough data for the road to be full of curves: hypotheses based on data that lead us to ask ourselves what is going on and what decisions we should make.
It’s not the bow that matters, but the Indian
We have technology, but people are more important. The analyst matters more than the tool.
We must start from the questions we want to answer. These questions dictate the type of data to be stored. What is being done is to work with a lot of technology but with little common sense, little head business.
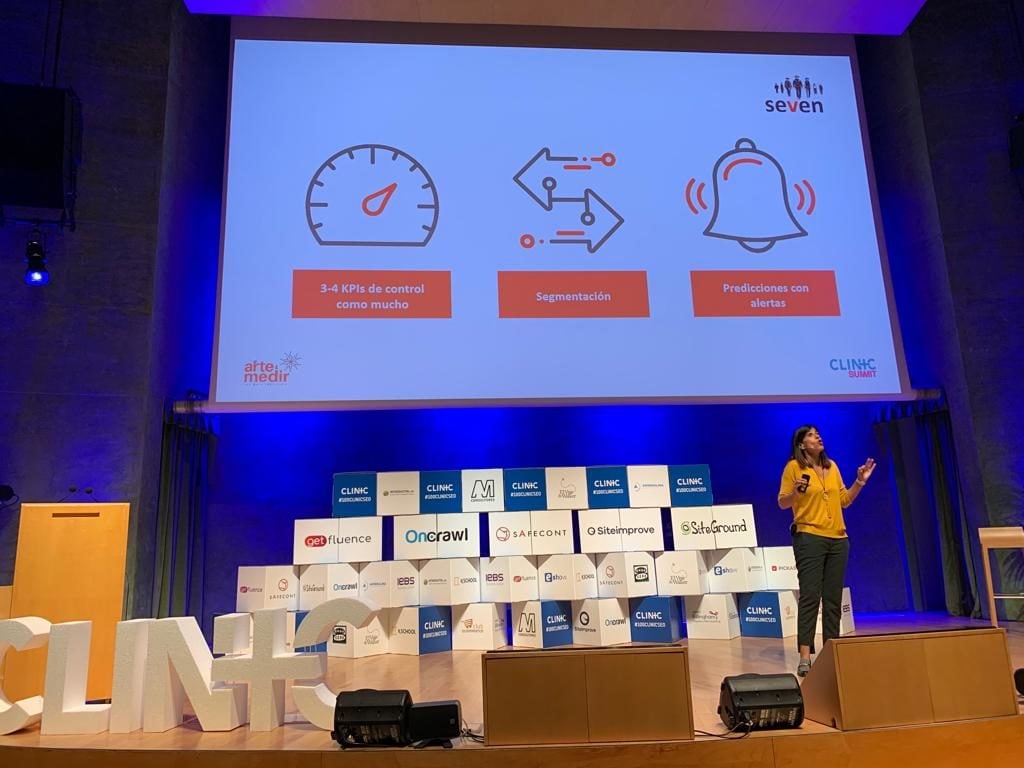
Gemma is committed to using few KPIs but the most important ones. Being able to have all the data does not mean that we have to use all of them.
The Magnificent SEVEN
Stakeholders
Stakeholders are the ones who pose the type of questions: business knowledge, problem description, the purpose of what is to be understood, analysis of the scenario, the environment, potential customer profiles, interactions, communication, exploration…
You have to understand what people in the business are concerned about. IT must talk to them to understand the business while ignoring the barriers of other departments to share what the technology can do and what is interesting to know.
It’s better to start small and build from there. And we’re talking about 8 hours of work to do a sample of what we need to do.
We start small and build from there.
Elements
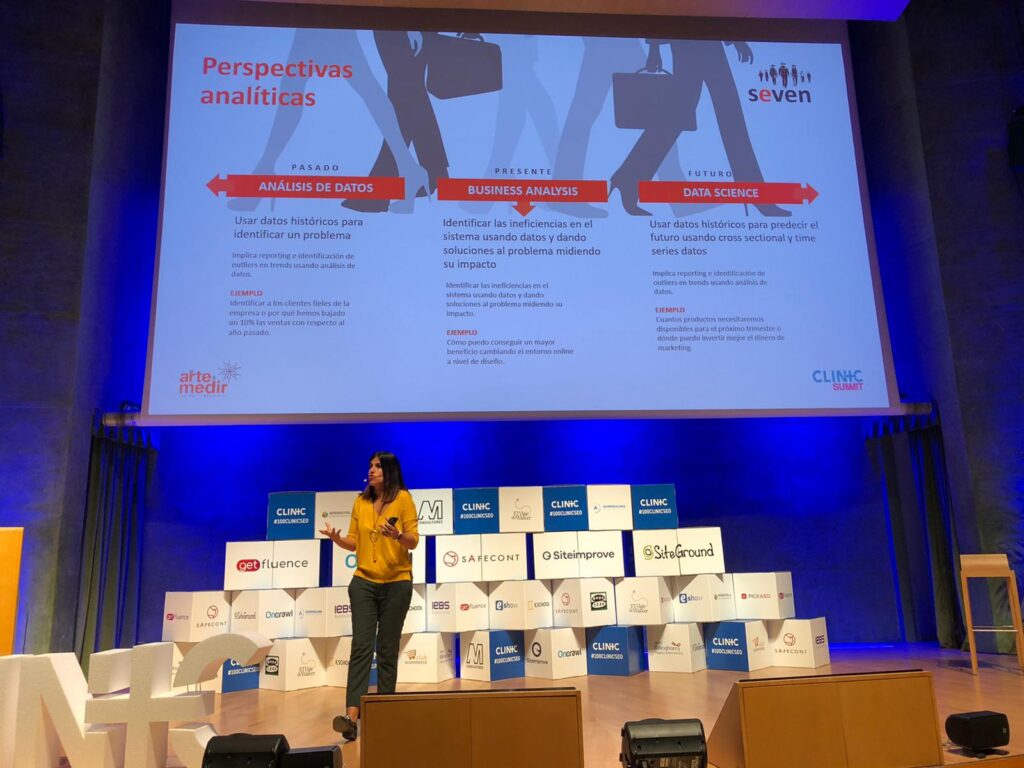
Close the computer and use your brain. What do we have to solve, what is the problem, what optics do we want to adopt and how do we want to solve it? We translate what we have been asked to do and move on to analytical perspectives: analysis of past, present or predictive data (from past data, predict the future). Descriptive, predictive and preventive models.
If we don’t know the question to answer, it doesn’t matter what technology you use. What matters is what we want to know. We base our decisions on alarms and become distressed. Let’s change this.
Visualization
We prepare dashboards or reports to understand what is happening and lead to data-driven decision making. It is important the graphical part that helps to understand the data.
Engagement
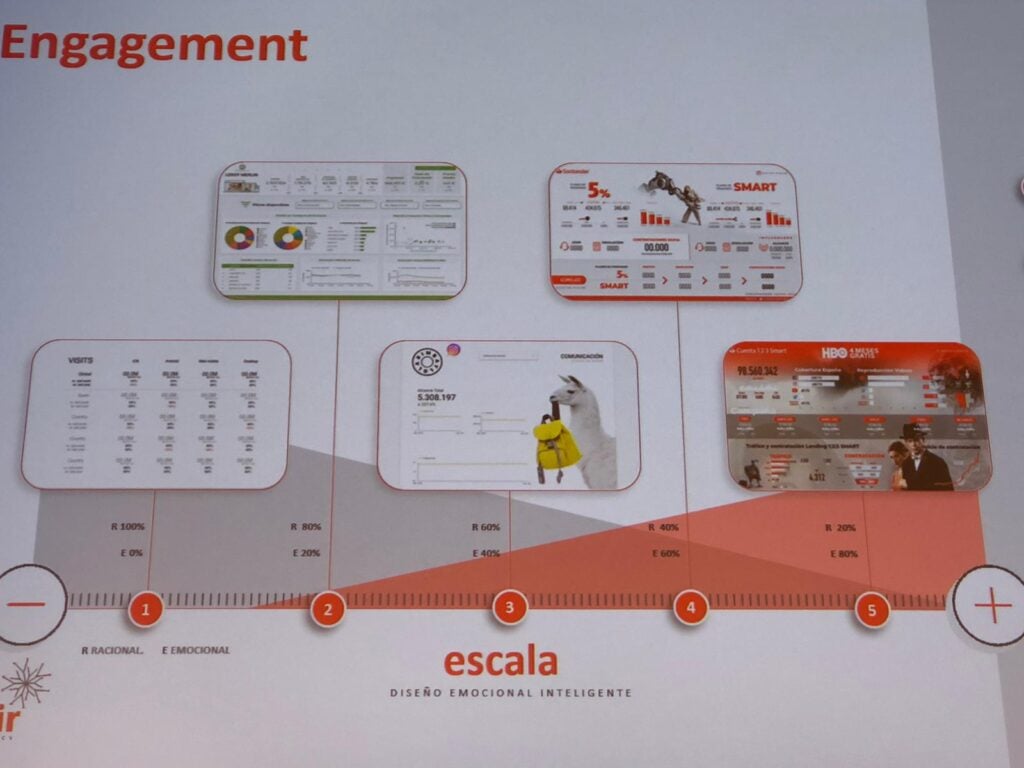
We manage to engage the person by understanding their profile and how they think. Now, people want features that excite them, that allow them to interact according to their style. We can see different styles of visualizations along this scale:
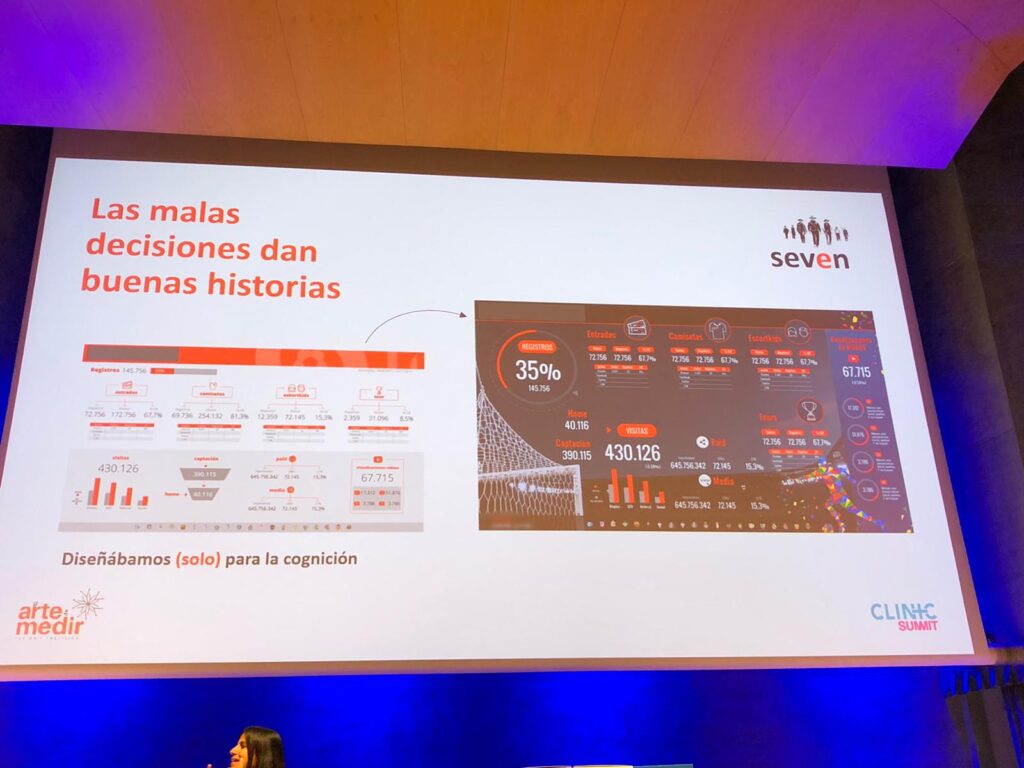
Bad decisions make for good stories. With the professional soccer league we presented a dashboard to which the only objection was that the Alavés shield was wrong.
We move on to this other dashboard:
Next action
If we wait until we have 80% of the information to make a decision, we are already late. The data will never be 100% correct. Act.
With analytical expertise and business insight plus intelligent visualization, we will make data impact the business. We need all three blocks for success.
The key is what you do with the data and that it impacts the business.
