Written by Merche Martínez
Index
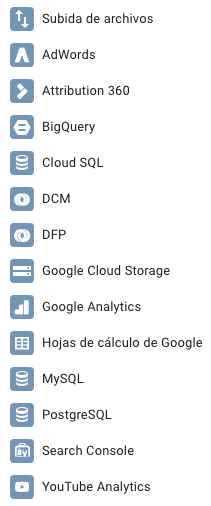
Google Data Studio is a tool that allows us to create dashboards and dynamic reports by obtaining data from different sources that we can define from the following connectors:
Although the applications of this tool can be numerous, we are going to focus on different types of web projects where the use of Google Data Studio can be useful.
Google Data Studio for e-commerce
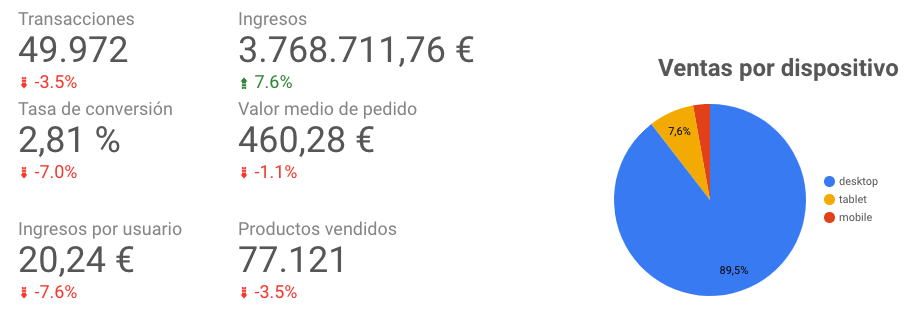
An interesting proposal for a Google Data Studio dashboard for e-commerce would consist of data from Google Analytics, which could also be contrasted with data from the online store’s database if it is in MySQL. Some of the data that could make up this study panel would be:
- Transactions (GA): these are the orders recorded in the e-commerce section of Google Analytics.
- Conversion Rate (CA): percentage of sessions that have generated an e-commerce transaction in Google Analytics.
- List of best selling products (GA)
- Actual sales (MySQL): completed orders that have been recorded in the e-commerce database (MySQL).
- Average order value (MySQL and GA): this data could be obtained from two data sources, MySQL and Google Analytics.
- Returns (MySQL)
- Revenue (MySQL and GA)
- Sales per device (GA)
- Abandoned shopping carts (MySQL)
- List of users who place the most orders (MySQL)
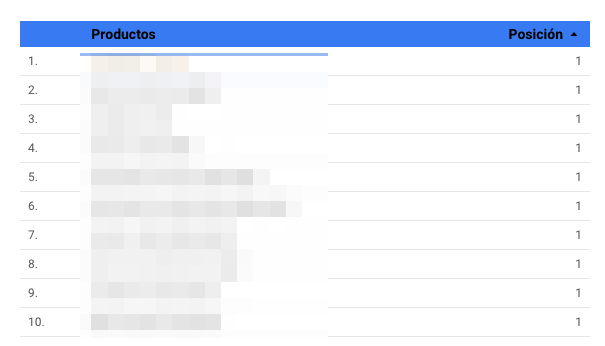
We can also include in our report the visibility of relevant search terms. In this case it could be the main products or categories. We can include the metrics of positions in organic search results that can be obtained from Google Search Console.
If PPC campaigns are carried out, data on the evolution of Google AdWords campaigns can be included:
- Clics
- Prints
- CTR
- CPC
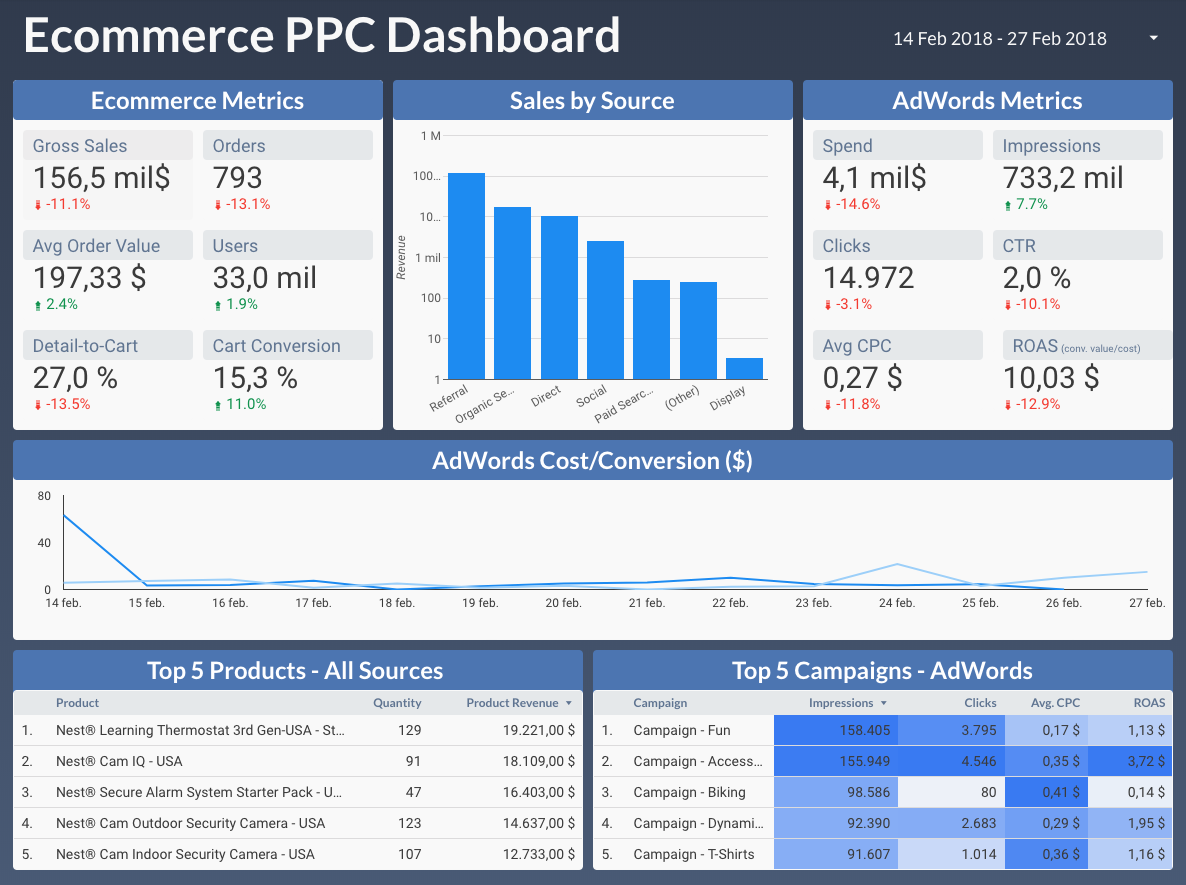
The following screenshot shows an example dashboard provided by Google Data Studio for tracking an e-commerce PPC campaign.
Google Data Studio for Media
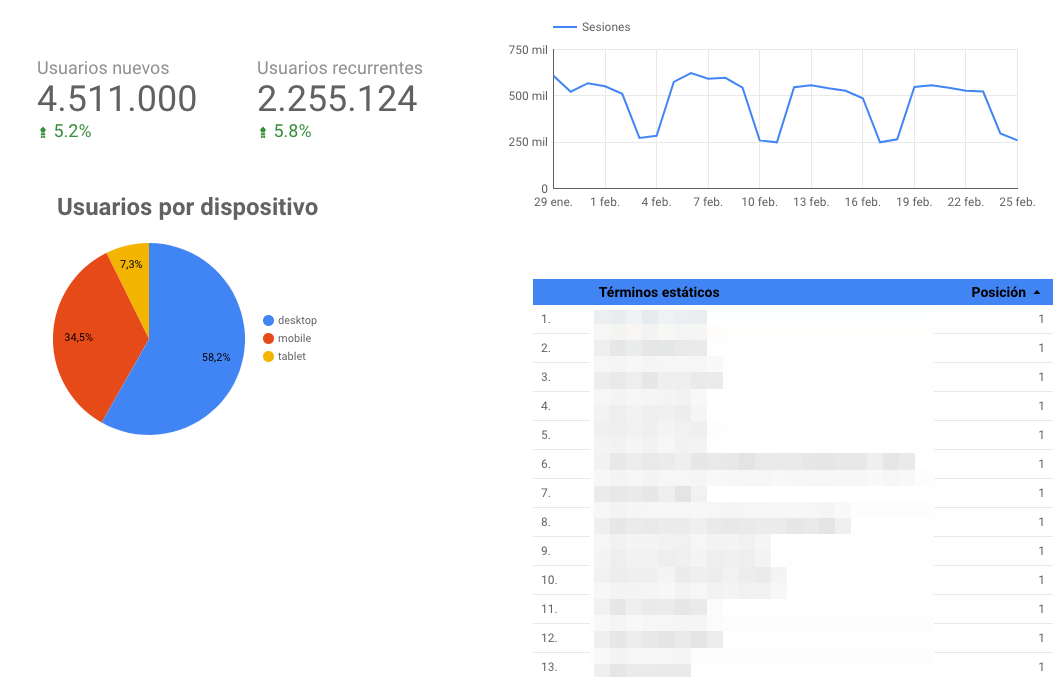
In case we are interested in SEO tracking for a media, Google Data Studio offers us the possibility of generating a report with highlighted data such as new users, recurring users and traffic to main sections. This data can be obtained from Google Analytics. We may also be interested in the evolution of positioning target terms. This data can be obtained from Google Search Console.
Tracking a blog with Google Data Studio
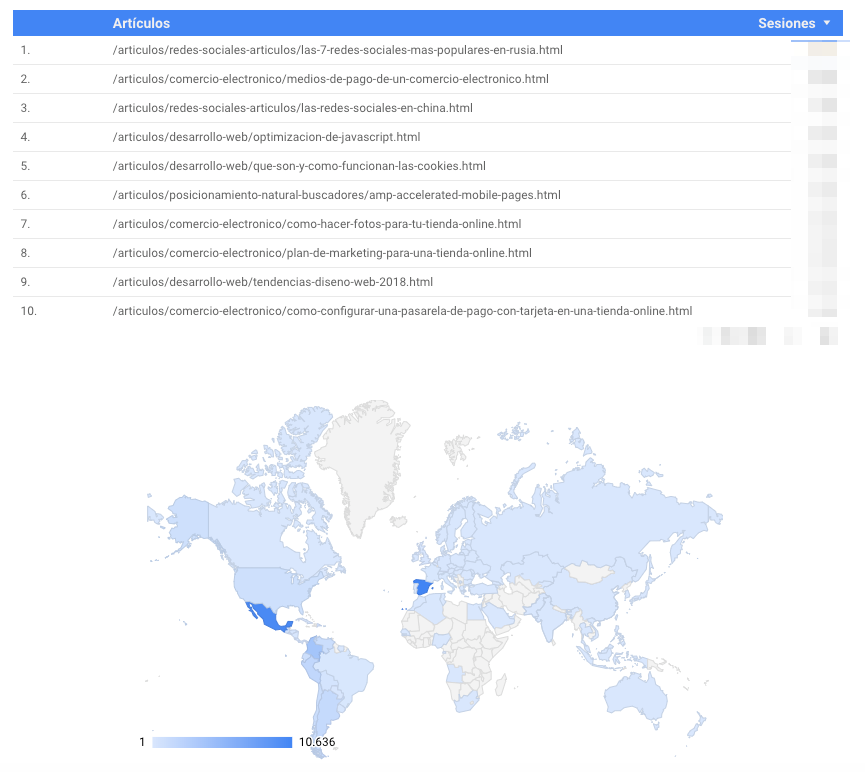
We now apply our smart dashboards generated with Google Data Studio to track a content blog. In this case it may be of interest to us:
- Most visited articles (GA)
- Geographical location of visits (GA)
- Top Category Tracking (GSC): we get it from search queries in Google Search Console.
What about data from other tools?
It is true that one of the things we miss is the possibility of having other sources of data. In this case, the option we have is to connect to a Google Drive spreadsheet where we have previously dumped the necessary data.
Google Data Studio interprets these spreadsheets as another data source and we can display the information with the graphical element that helps us the most: pie chart, time series, bar chart, tables, geographical map.
The following are examples of spreadsheets applied to reports with Google Data Studio for Sistrix and SEMRush.
Using Sistrix data in Google Data Studio
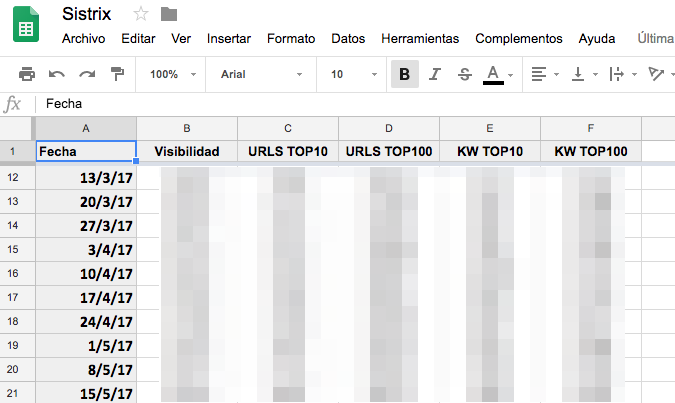
We see an example of how data from the Sistrix tool can be used in Google Data Studio. First we must create a spreadsheet that we feed with data from the tool.
Once we have this spreadsheet created, from Google Data Studio we create a new data source using it as a connector. And voila! This data can now be visualized in Google Data Studio reports.
Using SEMRush data in Google Data Studio
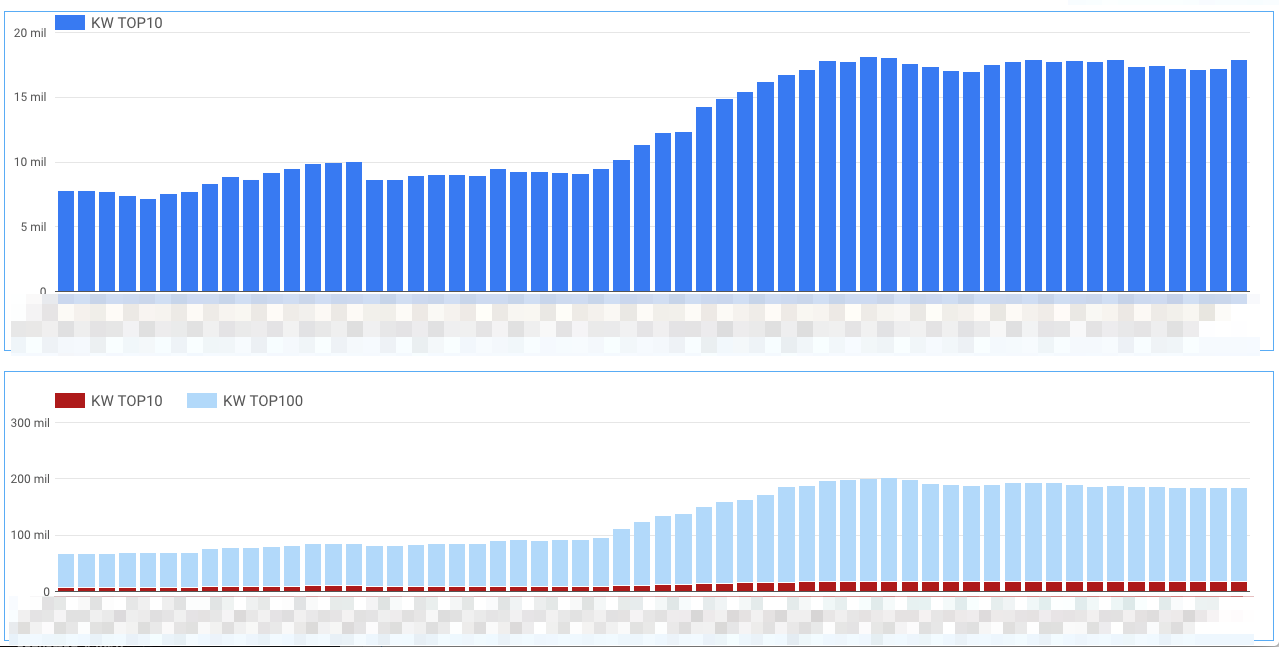
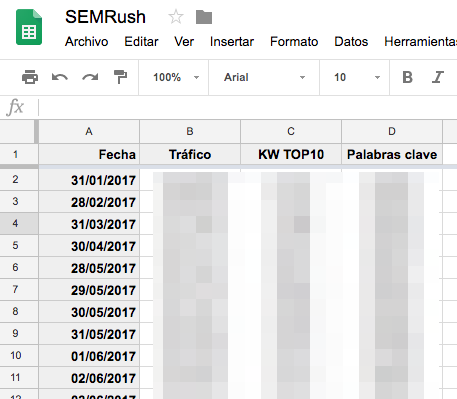
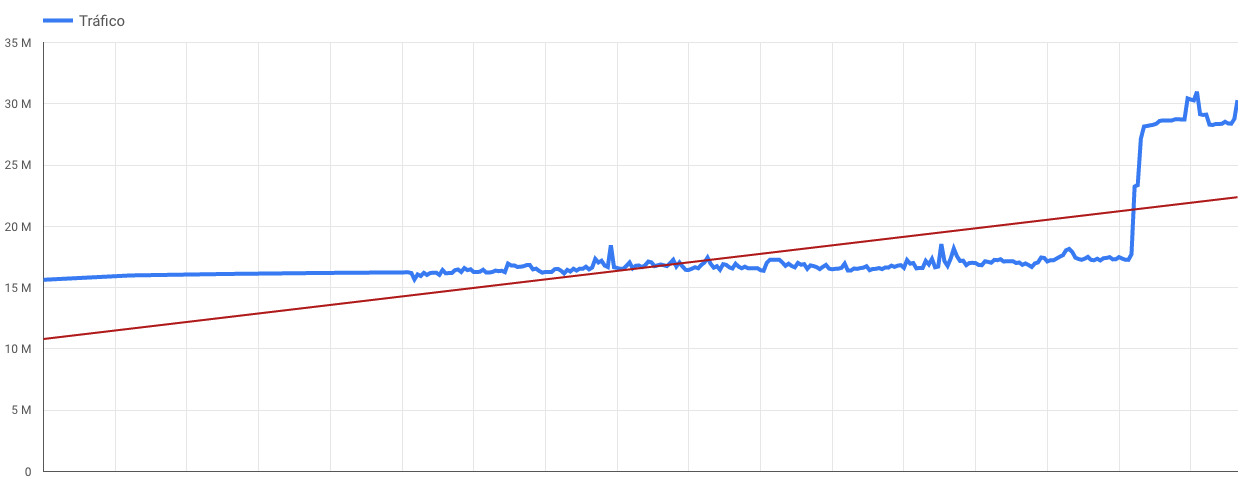
The procedure is the same with the SEMRush tool. In this case we obtain traffic data, keywords in the top 10 positions and total keywords.
Once the data has been recorded in the spreadsheet, we show in this example a time graph with the evolution of traffic over a period of time.
Google Data Studio vs Google Analytics panels
One of the first things that caught my attention when using this tool was the similarity with a Google Analytics functionality, the “dashboards”.
Google Analytics dashboards offer us the possibility to create very interesting and complete tracking reports. For a simple website, if we only wanted Google Analytics data this would be a good choice.
However, in case the study is performed on a website with different views, we have to create a panel for each of them. In this case, using Google Data Studio can be a very useful option.
An example would be a site with different language versions: Spanish and English. For the Spanish version view we would have a panel in Google Analytics and for the English version view we would have another panel. In Google Data Studio we could compare data from the two versions in the same report.
Pros and cons of using Google Data Studio
Given my experience with the tool, I consider it a very valid option for report generation. Although I have detected certain positive and negative points derived from the use of the tool.
The things that I believe add value:
- Updated data: being able to generate reports with updated data is positive for the monitoring of a web project. It is very convenient and useful since we can consult everything in a single tool. In addition, the date selector is flexible and we can select from a specific date to choose the last 7,14,28 days, the last month and several other options.
- Graphical comparison of data: as I mentioned earlier, the greatest strength of this tool is the ability to compare equivalent data from different Google Analytics views on the same sheet. For an SEO consultant like me, it can be useful to unify in one report organic traffic tracking from different projects.
- Time saving: time is money, so as mentioned in the previous points, the use of this tool can save us time reviewing different data sources on a daily basis.
- User guide: like all Google tools, we have at our disposal an extensive manual, in different languages, where the functionalities and elements of use are defined. You can see it here.
- Sharing: one of the star features of Google Data Studio, in my opinion, is the ability to share reports with third parties. It is possible to give permissions to collaborate in the report to other users who can be, only to view the report or who can also edit it. An example of use would be the possibility of creating a collaborative report with partners: seo, social media, PPC, etc. Each of the parties can create their own panels and together enrich the report.
The negative points in my opinion are:
- Historical loss: in this case one of the advantages also becomes a negative point. There are tools such as Google Search Console that have a limited data history, currently at 90 days. If we want to keep a timeline for a longer period of time it is necessary to save the data of this tool.
- Limited data sources: it is a Google tool and logically has the connectors it has. It would be ideal to be able to connect with other tools, but if that is not possible we have the option I mentioned to work with data from external tools.
- Limited functionalities: I miss being able to include comparative data in the tables. Although we can connect to Google Search Console, not much of the data can be obtained from this tool. It is still defined as a beta version. In recent months it has undergone a remarkable evolution. It is possible that little by little these points will be resolved.
In my opinion, Google Data Studio is a resource to be taken into account for the generation of reports, data comparison and evaluation of the evolution of a web project. Being of different themes as I have mentioned.
I am aware that there is a lot, a lot of potential that I still have to exploit the tool and that I will gradually discover. Any comments or use cases are welcome.
