Written by Jose Vicente
Just as important as obtaining all the relevant data for the correct evaluation of the KPIs of our business is to be able to visualize them quickly. Having a customized dashboard to review your site’s traffic data has the following advantages:
- Group the most relevant data.
- Saves time when reviewing performance.
- It unifies the way each of our team members analyze performance.
In conclusion, with the Google Analytics functionalities that we are going to describe below we will get an easy and fast way to evaluate the performance of our site. At a glance we will be able to know if the promotion of our website is being successful.
Control panels
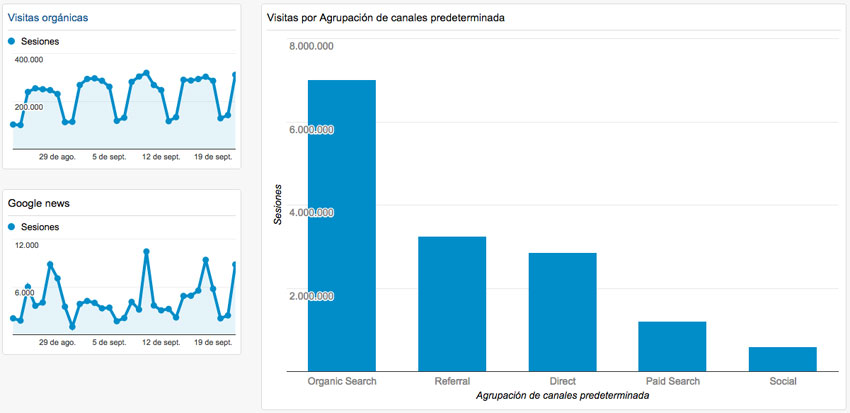
Google Analytics offers the possibility of having 20 control panels with 12 widgets each. The advantage of dashboards is that they allow us to quickly review the status of our accounts with summaries of various dimensions. Initially it offers a default dashboard, but the power of this functionality lies in the fact that we can create custom dashboards with the metrics that best represent the KPIs of our business.
Google Analytics offers us the possibility of configuring customized control panels for our site to speed up the analysis process.
The widgets used in the panels can be standard or real-time. Depending on the type of widget we can select one or several metrics and dimensions. It also allows us to filter the data displayed in each of the widgets.
When creating a new dashboard, it will not be visible to other users but Google Analytics offers three ways to share it:
- Share control panel: this option allows us to share a panel with other users of this view. It is very useful to be sure that all team members are analyzing the same panels.
- Share template link: generates a URL that we can send to other Google Analytics users so that they can apply it to other views. When sharing a template, we share the control panel settings, not the profile data. It is useful to have our standard panels that we can easily upload to all our customers’ accounts.
- Sharing in the solution gallery: we will be able to add it to the Google Analytics solution gallery so that other users can use our dashboards.
In addition to being able to set up our dashboards from scratch on a blank canvas, we can also put almost any report from our account into one of our dashboards by using the “Add to Dashboard” option. By selecting this option we can select the destination pane and the parts of the report we want to include in it.
Google Analytics dashboards can be emailed, but can only be exported to PDF.
Customized reports
Custom reports have the same features as standard reports that we can create customized to our needs. While dashboards offer a quick way to review your site’s metrics, custom reports generate more comprehensive reports.
If the standard Google Analytics reports do not meet our needs, we can resort to the custom reports
As in the standard reports, we can create custom reports of explorer, table or location type. We must always choose at least one dimension and one metric, being 2 the maximum number of selectable dimensions. In addition, we can create several tabs to group the metrics in the most useful way. Although, as with standard reports, there are combinations of dimensions and metrics that are not possible.
As in the dashboards, we can use filters to select only the most useful data for our analysis. It is also possible to configure the timely or periodic sending of reports and, unlike the control panels, in this case we are allowed to export to a large number of formats.
Shortcuts
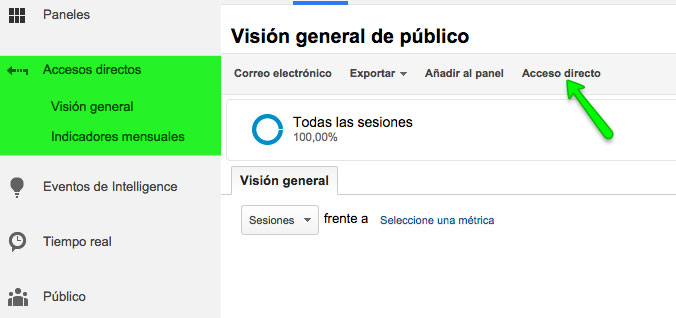
Shortcuts provide quick access to both standard and customized reports. Any settings that have been applied to the report, such as the selection of one or more advanced segments or the selection of a secondary dimension, will be saved in the shortcut. Just click on the “Shortcut” link above the report to add it.
Analytics shortcuts are unique to each user, but it is possible to share them using the email or “export data” function.
Although Google Analytics offers a considerable number of standard reports that can be adapted to our needs in most cases, if we know how to properly configure our own reports we can speed up the analysis process. By streamlining the analysis process we will make it faster and more effective in detecting possible options for optimizing the performance of our site.


