Written by Fran Estevan
Index
Google Trends is a simple and free tool that can be very useful during the research phase of any online marketing strategy. In this post we present some examples of how to exploit their different functionalities and put them at the service of our particular interest:
How to use Google Trends in SEM Campaigns
Whether we are talking about Google Adwords campaigns or any other ad platform on search networks, knowing the time of peak search intensity for a keyword is essential for our bidding. Although with the Keyword Planner we can observe the monthly evolution of a keyword, we can also keyword concrete, With Google Trends we will be able to refine our search and know exactly what day searches start to increase. This aspect is more relevant for seasonal searches, such as Christmas shopping or beach or mountain vacation reservations.
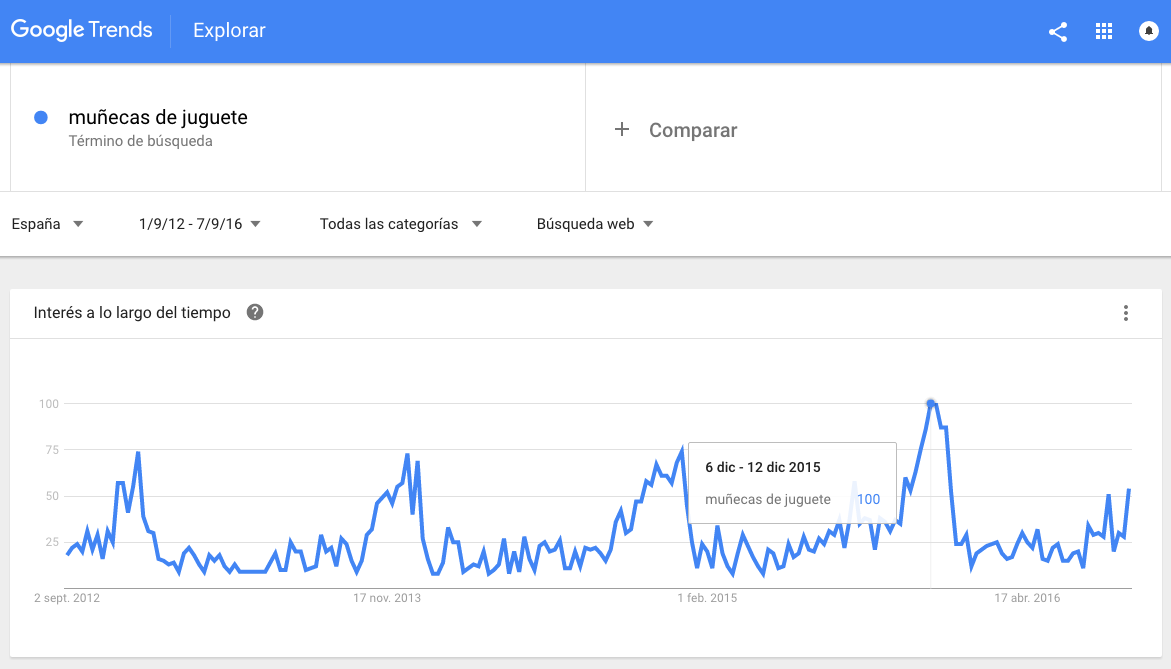
Let’s take an example: imagine you are the owner of an online toy store, and you are planning the calendar of tactical actions for the Christmas campaign of your flagship product, toy dolls. In the “Interest over time” graph we can confirm the seasonality of searches, which peak every December. If we narrow our query further, selecting only a custom time interval of the last 3 years, we will see more detailed results on a weekly basis. Thus, Google Trends tells us that the optimal time to start our Adwords campaign will be the period in which the search trend begins to grow (early November), and that we should optimize it before it reaches its peak (from December 6 to 12).
On the other hand, the results of the analysis obtained in the “Interest by region” section can help us to determine the geographic coverage of our campaign, or to adjust the bidding by location according to the interest aroused.
Continuing with our example of an online toy store, let’s imagine that we want to know the locations where the “kitchenettes” are most popular. This information can be obtained in the “Interest by sub-region” chart, where we can filter by Autonomous Community (Sub-region) and by City. Thus, judging by the results of the graph, we can conclude that for our “kitchenettes” campaign we should increase the bid adjustment in Santander, Malaga, Seville, Valencia and Barcelona.
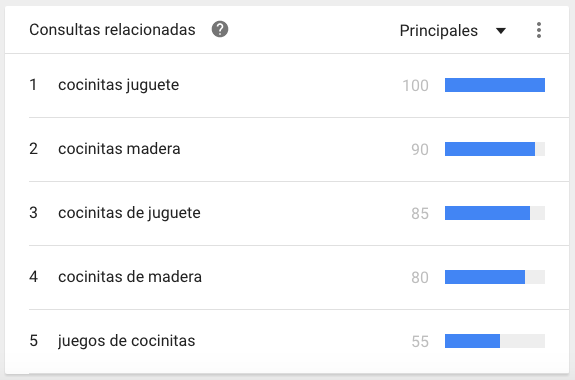
Finally, in related searches we can discover new ideas to increase the number of keywords we are bidding on in a particular ad group. Continuing with the previous example, for our “kitchenette” campaign, observing the related queries we will know that users also tend to search for “toy kitchenettes”, “wooden kitchenettes” or “kitchenette games”, keywords that we should add to our campaign to increase the chances of our ads appearing in the top positions.
How to use Google Trends in content marketing strategies
For this type of strategy we can resort to an application similar to the one we have already seen in SEM campaigns. Depending on the intensity peaks we find in the “Interest over time” area, we can determine the ideal date for the publication of our content to coincide with the highest volume of searches by users. In this way, we will articulate our publication calendar and its diffusion in other channels such as social networks in an optimal way, achieving an increase in traffic to our site.
Let’s go back to the example of an online toy store, and imagine that we also have a blog to offer interesting content related to our products (news, ideas for playing with children, etc.). In the case of the “toy dolls” campaign, looking at the “Interest in searches” graph, we know that the ideal time to publish and dynamize our content on toy dolls is during the month of November and the first half of December.
Likewise, in the Related Queries section we can find some keywords that it would be advisable to use in our contents.
How to use Google Trends for market research and competitor analysis
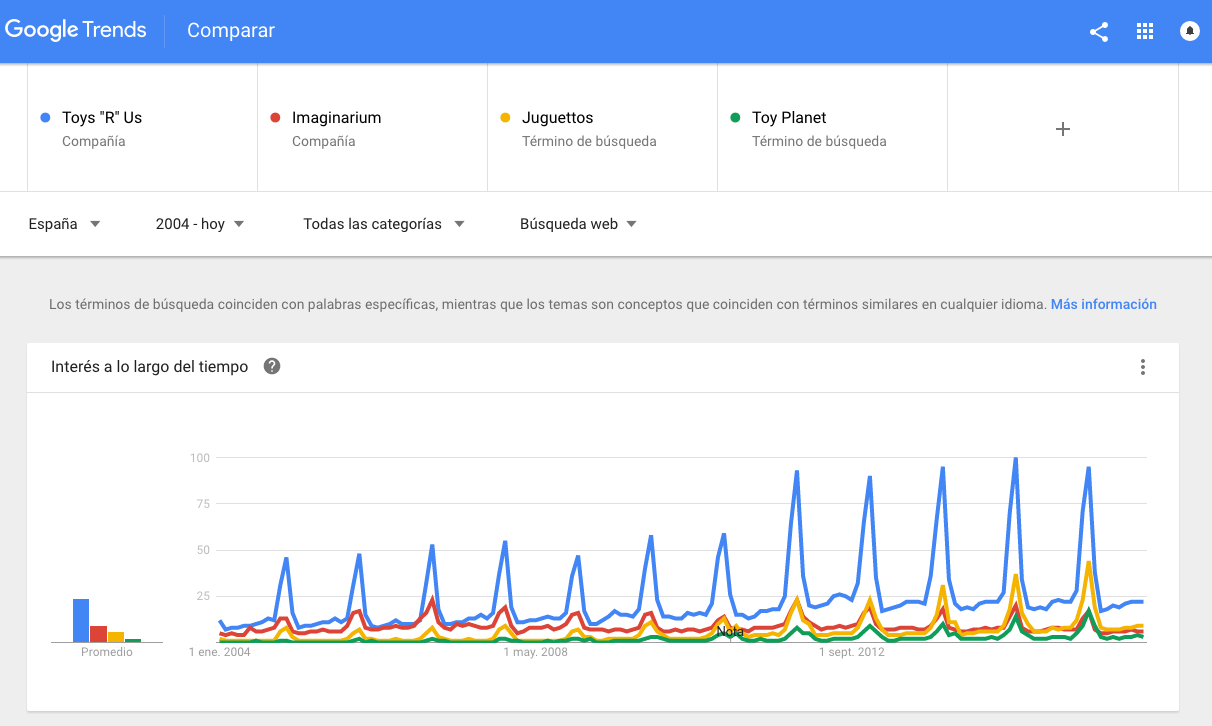
It may be the most obvious application of Google Trends, but also where we can get the most out of it. The ability to analyze up to 5 search terms simultaneously can help us to know the market share of our competitors, entering as keywords the commercial brands or products of the same category. In this way, we could establish a direct relationship between search interest and other indicators of our competitors’ activity, whether they are marketing indicators, such as the number of visits to their website or advertising pressure in major media, or commercial indicators, such as the volume of sales achieved.
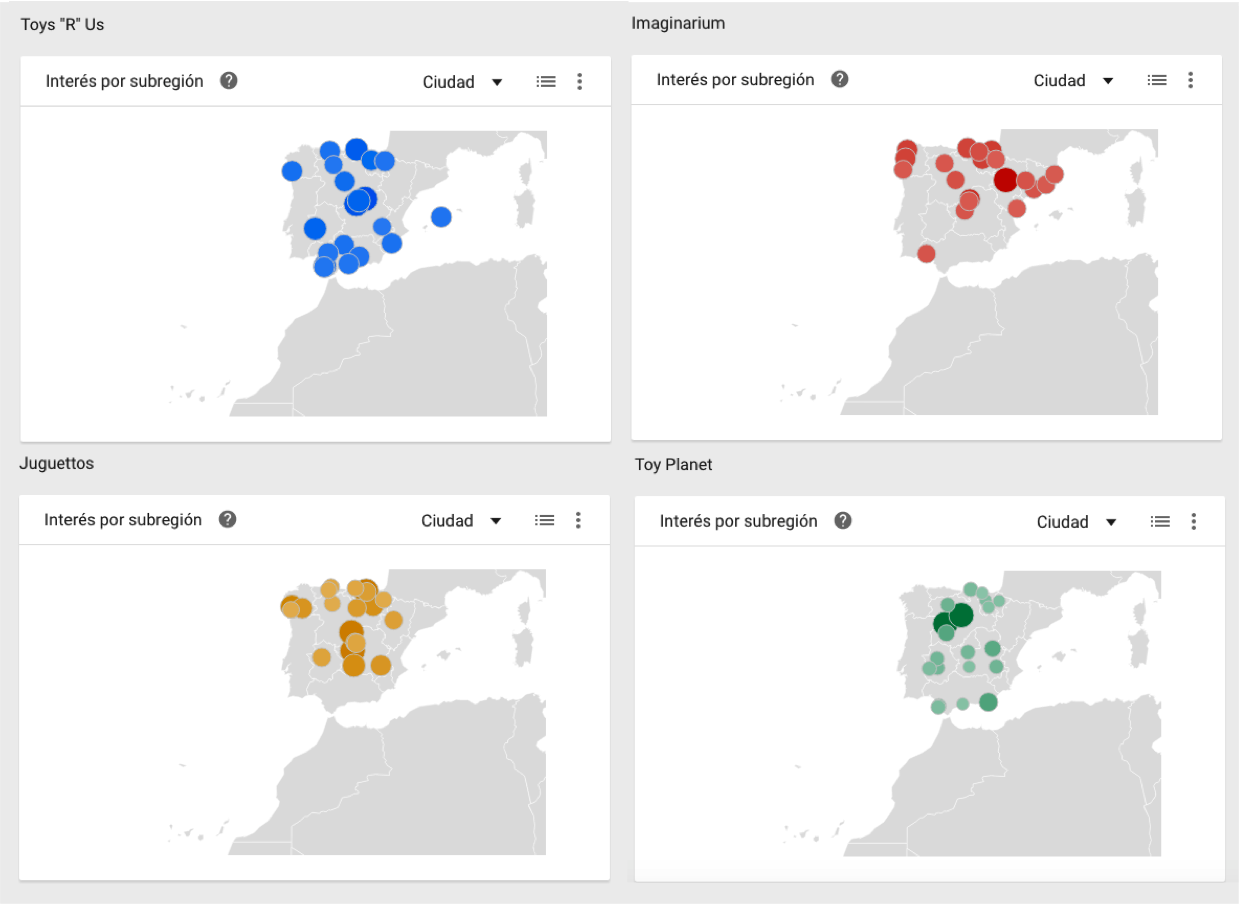
For example, let’s imagine that we want to know the strength of our online toy store’s competitors. For this purpose, we have introduced 4 of our main competitors to know their evolution over time and their current popularity status.
Working with the results obtained
Finally, we should note that Google Trends allows us to export the data to a .csv file or to Google Documents. In this way, we will cross-reference the data with other indicators obtained from other tools, or, if we use the same filtering range, we could incorporate as many search terms as we wish into our analysis.
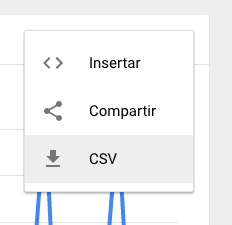
To export the data we only have to click on the options button located in the right corner of each graph, and select “CSV”. If we wish, we can also obtain a script of the graph in HTML to insert it in a web page, or share the graph in our social networks.
As you have seen, in addition to satisfy our curiosity about any event with a minimum reflection in the online world, in Google Trends we have at our fingertips a multitude of data with which to make vital decisions for our online marketing strategies to be effective. However, I am sure that in this post we have only scratched the surface. Can you think of any other application? If so, or if you simply want to share your experience with us, tell us about it in the comments section.
